
13-Week Cash Flow Forecast: The Direct-Method Guide for Finance Teams in QuickBooks


The 13-week cash flow forecast is the standard short-term liquidity tool in corporate finance. Turnaround advisors, restructuring bankers, and lender covenant teams all use the same weekly, direct-method structure to project 90 days of cash receipts and disbursements. Companies not in distress use it too, because it surfaces cash risks that monthly accrual reporting misses by weeks.
This guide covers the direct-method forecast structure, the receipt and disbursement categories a finance team maintains, the QuickBooks data pull required each Monday, the variance tracking discipline that keeps the forecast honest, and the six mistakes that undermine forecast accuracy.
What is a 13-week cash flow forecast?
A 13-week cash flow forecast is a rolling, weekly-grain, direct-method projection of cash receipts and disbursements covering one quarter (roughly 90 days). The forecast tracks actual cash movement in and out of bank accounts, not accrual-basis income and expense.
Each Monday, the finance team drops the past week (with actuals) and adds a new future week, maintaining a constant 13-week horizon. Actuals replace forecasts for the completed week. Forward-week numbers get refreshed with new information: signed contracts, updated vendor bills, delayed customer payments, and revised debt-service schedules.
The forecast is the operating language of financial distress and the base tool of every restructuring engagement. Deloitte, BDO, and every turnaround advisory practice publish 13-week templates because they double as the communication tool with lenders during covenant negotiations. Companies not in distress use the same structure to run finance proactively.
Why 13 weeks specifically?
Three reasons drive the 13-week length across turnaround practice.
One quarter. Thirteen weeks equals 91 days, one full quarter. Board reporting, lender covenants, and internal budgets all run on quarterly cycles. The forecast horizon matches the review horizon.
Standard billing cycles. Customer payment terms of 30, 60, and 90 days all fit inside the 13-week window. The forecast captures the collection ramp from every invoice cycle without projecting further than the AR aging supports.
Signal-to-noise balance. Weekly grain is precise enough to catch cash gaps that monthly averages hide. Thirteen weeks is far enough to plan drawdowns and capital raises without falling into noise from unmodeled long-term events.
Some firms extend the model to 26 weeks (six months) or run it as a 13-week rolling on top of a 12-month annual model. The 13-week core remains the standard.
What is the structure of a 13-week cash flow forecast?
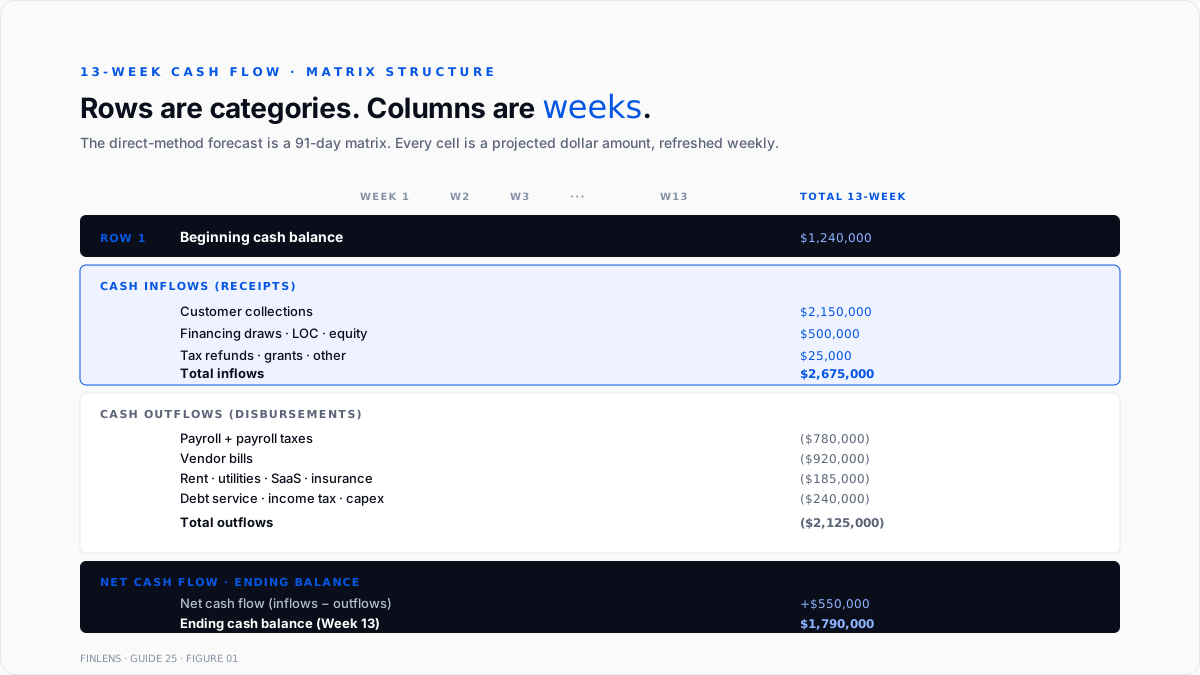
The forecast is a matrix. Rows are cash flow categories. Columns are the 13 weeks, dated by the Friday of each week. Each cell is a dollar amount.
Row 1: Beginning cash balance. The actual bank balance at the start of Week 1. Subsequent weeks pull the ending balance from the prior week.
Rows 2 to N: Cash inflows (receipts).
- Customer collections (broken out by customer for concentration risk)
- Financing draws (line of credit, term loan)
- Equity or SAFE receipts
- Tax refunds or grants
- Other receipts (asset sales, insurance recoveries)
Rows N+1 to M: Cash outflows (disbursements).
- Payroll (regular pay cycles by exact draft date)
- Payroll taxes (separate from payroll for accurate timing)
- Vendor bills (broken out by top vendors)
- Rent and occupancy
- Utilities and telecom
- Software and SaaS
- Insurance premiums
- Debt service (principal + interest)
- Income tax payments
- Sales tax remittance
- Capital expenditures
- Distributions or draws
Row M+1: Net cash flow. Total inflows minus total outflows for the week.
Row M+2: Ending cash balance. Beginning cash plus net cash flow. This becomes the next week's beginning balance.
Row M+3 (optional): Available liquidity. Ending cash plus undrawn credit facility capacity. This is the number lenders and boards actually watch.
What is the difference between the direct method and the indirect method?
The direct method forecasts actual cash receipts and disbursements. The indirect method starts with net income and adjusts for non-cash items and working capital changes. Both produce the same ending cash balance. Only the direct method works for a 13-week forecast.
The reason is precision. A 13-week forecast is used to answer, "Will we have enough cash next Friday to make payroll?" That question needs the actual payroll draft date, the actual customer collection date, and the actual vendor payment date. Non-cash adjustments and working capital reconciliations do not translate to weekly cash-in-hand.
The indirect method remains the standard for statutory cash flow statements under US GAAP because it reconciles to net income. Detailed coverage of the direct-method construction is in Finlens' direct method cash flow guide, and the cash-versus-accrual distinction is covered in Finlens' cash flow vs. profit guide.
How is a 13-week cash flow forecast built in QuickBooks?
The construction runs in six steps. Each step pulls a specific QBO report and feeds a specific section of the forecast.
Step 1: Pull the starting cash balance. Run the balance sheet as of the Sunday before Week 1. Sum every bank account balance. This is Row 1, Column 1.
Step 2: Build the customer collection forecast. Run the A/R Aging Detail report. Group open invoices by expected pay date, not invoice date. Use customer-specific payment history: 30-day-terms customers who pay Net 45 in practice show up in the correct week.
Step 3: Build the vendor payment forecast. Run the A/P Aging Detail report. Group open bills by planned pay date. Distinguish must-pay (rent, utilities, payroll taxes) from discretionary (vendor bills with float). Discretionary bills flex to preserve liquidity if collections slip.
Step 4: Pull payroll timing. Confirm every payroll draft date over the next 13 weeks with the payroll processor (Gusto, Rippling, ADP, or QBO Payroll). Include both net pay drafts and tax remittance drafts. Coverage of the third-party payroll journal entry mechanics is in Finlens' team journal entry automation guide.
Step 5: Load recurring disbursements. Rent, insurance premiums, software subscriptions, and debt service each have known payment schedules. Load each on its actual due date in the correct week.
Step 6: Reconcile to Week 0 actuals. Before the forecast goes live, back-test the model against the prior four weeks of actual bank activity. Every actual should reconcile to a category on the forecast. Categories the actuals hit but the forecast missed are gaps in the model.
How is QBO accrual data converted to cash for the forecast?
QuickBooks Online defaults to accrual accounting. The 13-week forecast is cash-basis. Three conversions are required.
Convert revenue to collections. Accrual revenue posts when an invoice is issued. Cash collections happen when the customer pays. The forecast uses expected collections timing from the A/R aging, weighted by historical customer pay behavior.
Convert expense to disbursements. Accrual expense posts when a bill is received. Cash disbursement happens when the check clears or the ACH drafts. The forecast uses expected pay dates from A/P aging plus scheduled recurring disbursements.
Remove non-cash items. Depreciation, amortization, and accrued liabilities that will not settle in cash within the 13-week window are excluded entirely. They belong in the P&L, not the cash forecast.
QBO's built-in "Cash Flow Planner" tool produces a cash-basis projection but at a monthly grain. Weekly grain requires either a manual model in Excel or a dedicated cash flow platform.
What is variance tracking, and why does it matter?
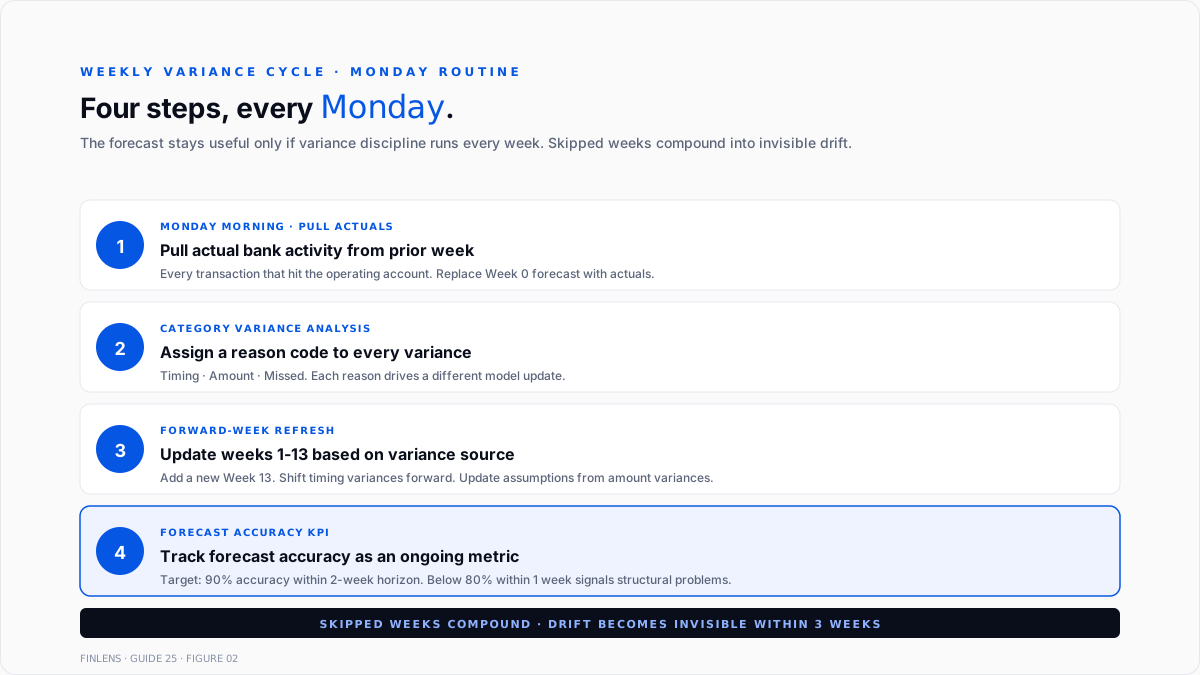
Variance tracking is the weekly discipline of comparing forecasts to actuals and updating the model. Without it, the forecast drifts from reality within two to three weeks.
Weekly forecast-to-actual comparison. Every Monday, the finance team pulls actual bank activity for the completed week. Each actual transaction maps to a forecast line. Actuals replace forecasts for Week 0.
Variance analysis by category. Where actuals differ from forecasts, the finance team assigns a reason: timing (money arrived a week early or late), amount (invoice paid at a different value), or missed (transaction not on the forecast at all). Each reason drives a different model update.
Forward-week refresh. Timing variances shift future weeks. Amount variances update the forecast assumption. Missed transactions get added as new forecast lines going forward.
Forecast accuracy tracking. Best-practice finance teams track forecast accuracy as a KPI. A 90% accuracy rate within a two-week horizon is a reasonable target. Below 80% within one week means the model has structural problems.
Variance discipline turns the forecast from a static Excel file into a live operating tool. The detailed variance framework is in Finlens' budget variance report guide.
What are the most common 13-week cash flow forecast mistakes?
Six mistakes appear in almost every finance team's first 13-week model.
Using accrual data without conversion. The forecast pulls the P&L directly and treats revenue as collections. Cash arrives 30 to 90 days later, so the model overstates near-term liquidity. Fix: use A/R aging with expected pay dates, not the revenue line.
Missing payroll tax timing. Net payroll drafts on payday. Federal tax deposits draft one to three business days later depending on the schedule. State withholding drafts on a separate cadence. Treating payroll as one lump-sum draft misses the true cash outflow pattern.
Ignoring credit card float. Credit card charges post to the P&L on the transaction date but disburse cash 30 to 60 days later when the card statement pays. Firms that ignore this over-forecast near-term outflows.
Forecasting revenue as evenly distributed. Customer collections are not smooth. They concentrate around invoice due dates, month-end, and quarter-end. Even distribution creates false confidence in the middle-week liquidity.
Skipping the debt service schedule. Term loan payments, line of credit interest, and equipment financing each have specific weekly draft patterns. Missing any one creates a surprise cash gap.
Never updating the model. A forecast built once and never refreshed is a static budget, not a rolling forecast. Weekly variance analysis is what makes the 13-week model useful.
Conclusion
Finlens is a QuickBooks-compatible AI accounting platform. For finance teams running a 13-week cash flow forecast, Finlens automates the QBO data pull, the accrual-to-cash conversion, and the weekly variance analysis that manual models require.
Every Monday, Finlens pulls actual bank activity from the prior week and maps each transaction to a forecast category. Actuals replace forecasts in Week 0 automatically. Variances are flagged with a reason code (timing, amount, or missed) and the forward weeks are updated based on the source.
The A/R aging and A/P aging pulls happen continuously rather than in a weekly batch. Expected customer collections update the moment a payment date is committed. Vendor bill payment dates flex to preserve liquidity as cash constraints tighten. Payroll and recurring disbursement schedules load from the payroll processor and vendor contracts, not manual entry.
For CFOs managing multiple entities, Finlens's multi-entity view rolls up 13-week forecasts across every subsidiary into a consolidated cash position. Intercompany transfers, dividend distributions, and centralized debt service all model at the entity level and consolidate at the parent level. That multi-entity workflow is documented in Finlens' intercompany reconciliation guide.
For founders and small-business owners running the model themselves, the same automation reduces the weekly maintenance cycle from four hours to under thirty minutes. Coverage of the founder cash management framework is in Finlens' startup savings guide.
.png)
FAQ
Why is a cash flow forecast 13 weeks and not 12?
Thirteen weeks equal 91 days, matching one calendar quarter more precisely than 12 weeks (84 days). The quarter alignment matches board reporting, lender covenant windows, and 30/60/90-day billing cycles. Twelve weeks miss the third month's back-half collections and disbursements.
What is the difference between a 13-week cash flow forecast and a 12-month cash flow projection?
The 13-week forecast is weekly, direct-method, and tactical. It answers "Will we make payroll?" and "Will we meet the covenant?" The 12-month projection is monthly, often indirect-method, and strategic. It answers "how much capital do we need this year" and "when will we break even?" Firms in tight cash situations run both.
Should the 13-week forecast include depreciation?
No. Depreciation is a non-cash accrual entry. The forecast tracks actual cash movement. Depreciation belongs on the P&L, not on the cash forecast.
How often does the 13-week forecast get updated?
Weekly. Every Monday morning, actual bank activity from the prior week replaces the forecast for Week 0, and Week 13 gets added. Forward weeks are refreshed based on variance analysis. Any less-frequent update means the forecast drifts from reality.
Can a 13-week cash flow forecast be built in QuickBooks directly?
QBO has a Cash Flow Planner tool that produces a monthly cash-basis projection but not a weekly forecast. Weekly grain requires either a manual Excel model tied to QBO reports (A/R aging, A/P aging, balance sheet) or a dedicated cash flow platform. Most finance teams start in Excel and graduate to a purpose-built tool as complexity grows.
What is a rolling forecast?
A rolling forecast maintains a constant horizon by dropping the oldest completed period and adding a new future period each update cycle. A 13-week rolling forecast always shows the next 13 weeks from the current week, regardless of calendar month or quarter position. This differs from a static budget locked to a calendar year.
How is customer payment timing forecasted accurately?
Use each customer's historical days-sales-outstanding (DSO), not the invoice payment terms. A customer with 30-day terms that consistently pays in 45 days should be forecasted at 45 days. Weighted-average DSO by customer segment produces the most accurate collection forecast.
What is the "available liquidity" line, and why does it matter more than ending cash?
Available liquidity equals ending cash plus undrawn credit facility capacity. Lenders and boards watch this because it captures the firm's total funding buffer against the next cash gap. A firm with $500K ending cash and a $2M undrawn line of credit has $2.5M in available liquidity, which is what covenant tests typically measure.

