
Balance Sheet Analysis in QuickBooks: The Current Ratio Your File Is Lying About


Your current ratio is 1.96. Your covenant is 1.50. You are comfortable.
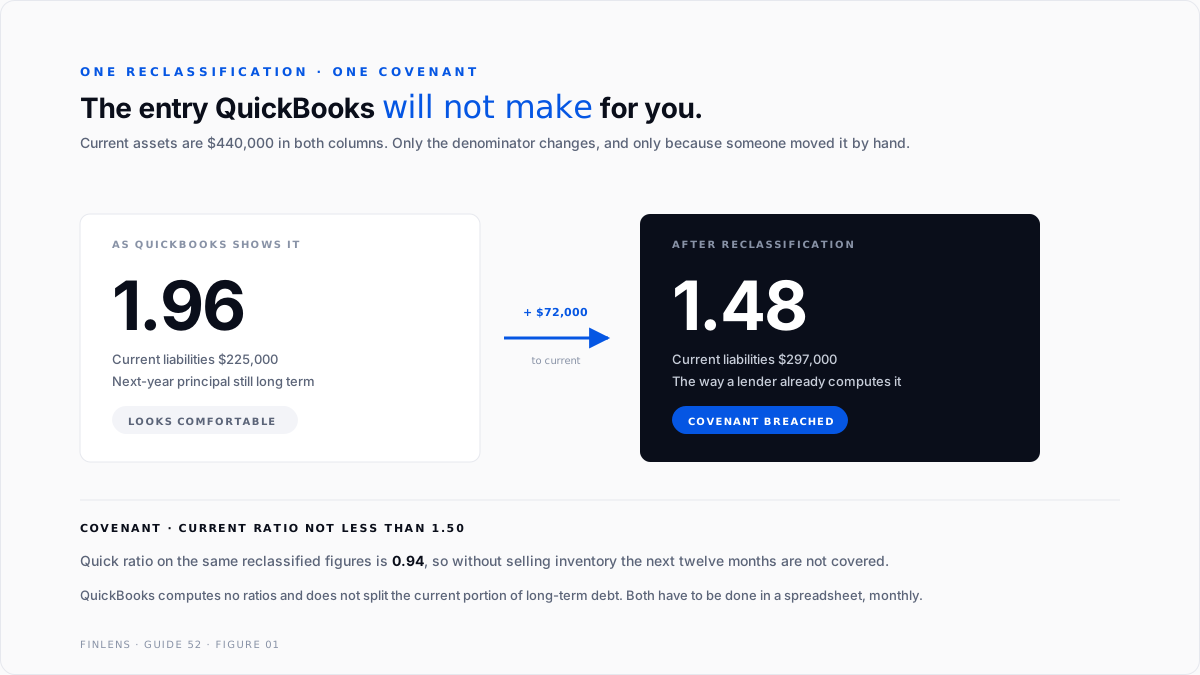
Except the balance sheet QuickBooks printed has $72,000 of next-year loan principal sitting in Long Term Liabilities, where it does not belong. Move it to current, where the lender's spreadsheet already has it, and the ratio is 1.48.
QuickBooks will not do that reclassification for you. It also will not compute the ratio. Both of those are documented, both are long-standing, and together they mean every liquidity number taken straight off a QuickBooks balance sheet needs work before it means anything.
This guide is about the work.
What this guide is not
This is the diagnostic layer, and it assumes the two layers beneath it are already done.
How to read a balance sheet, a founder's guide covers what the statement is and how to read it. Balance sheet reconciliation covers proving each account balance back to its support.
Neither covers analysis. What follows assumes your balances are right and asks what they mean.
QuickBooks does not do ratios
Start with the plain fact, because people spend hours looking for a report that does not exist.
A user posting as se.sharpe asked the direct question in How do I run a quick ratio (or any of the ratio reports) in QB?, 8 replies and 16 views.
The answer came from Rustler: "QB does not do financial ratio reports, a long time sadly lacking aspect of reporting."
The recommended workaround is to export the balance sheet to a spreadsheet and do the arithmetic there. That is still the answer, and it is fine, provided the balance sheet you export is classified correctly. Usually it is not.
The classification QuickBooks will not fix
A user posting as phxuser asked whether QuickBooks Online calculates the current portion of long-term debt, in a thread titled CPLTD, 2 replies and 32 views.
The answer from john-pero was no, and it applies to most Desktop versions too. The next twelve months of principal has to be moved to a current liability manually, by journal entry, from the loan amortization schedule, and the entry has to be updated as payments are made.
That is one reclassification nobody runs, and it is the single largest distortion in a small company's liquidity numbers.
Three more classification traps sit alongside it.
Account type is the only thing driving the split. QuickBooks classifies the balance sheet by the account type you chose when you created the account. Nothing validates it. A prepaid insurance account created as Other Assets rather than Other Current Assets drops straight out of your current ratio.
Credit cards are current liabilities. They have their own account type and they belong in the denominator. Files that exclude them because they "feel like" a payment method understate current liabilities.
Undeposited Funds is a current asset. If it is carrying a stale pile, it inflates current assets with money that may not exist.
Worked example: the ratio that breached a covenant
A distributor, at the end of a quarter.
Long term liabilities carry a $300,000 note, of which $72,000 falls due in the next twelve months.
The ratio QuickBooks implies. $440,000 over $225,000 is 1.96.
The ratio after reclassification. Current liabilities become $225,000 plus $72,000, which is $297,000. $440,000 over $297,000 is 1.48.
A covenant set at 1.50 is already breached, and the only thing that changed was moving a number the software was never going to move.
The quick ratio. Strip inventory and prepaid expenses from the numerator. $440,000 less $142,000 less $18,000 is $280,000. Over $297,000 that is 0.94.
Below 1.00 means that without selling inventory, this business cannot cover the next twelve months of obligations from assets it already holds.
The four numbers worth computing
Two liquidity ratios and two speed measures. Everything else is a refinement.
Current ratio, current assets over current liabilities. A position at a point in time.
Quick ratio, current assets less inventory and prepaid expenses, over current liabilities. The same position, assuming you cannot sell anything.
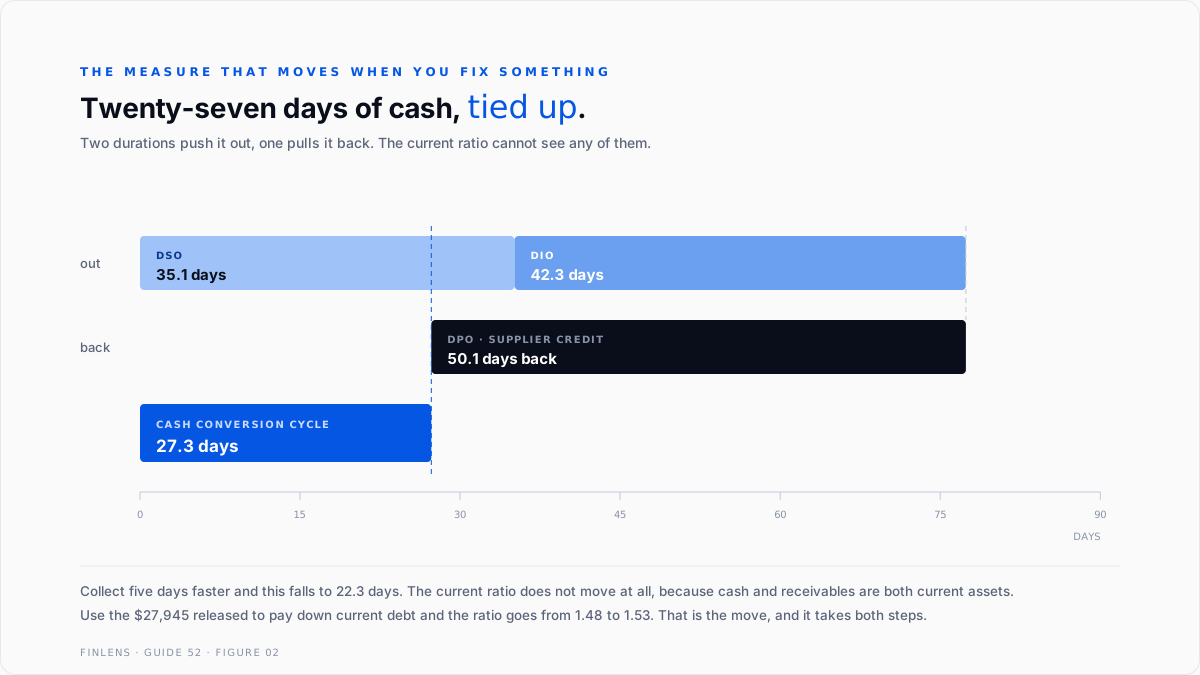
Days sales outstanding, receivables over average daily revenue. At $2,040,000 of annual revenue, average daily revenue is $5,589.04, so $196,000 of receivables is 35.1 days.
Days payable outstanding, payables over average daily cost of sales. At $1,224,000 of annual cost of sales, average daily cost is $3,353.42, so $168,000 of payables is 50.1 days.
Add days inventory outstanding, $142,000 over $3,353.42, which is 42.3 days, and you get the measure that matters most.
Cash conversion cycle is 35.1 plus 42.3 less 50.1, which is 27.3 days. That is how long a dollar is tied up between leaving you and coming back.
Working capital is a dollar figure before it is a ratio
The ratio is for lenders. The dollar amount is for you.
Working capital is current assets less current liabilities. On the reclassified figures above, $440,000 less $297,000 is $143,000. That is the cash permanently tied up in running the business at its current size.
Now express it against revenue. $143,000 over $2,040,000 of annual revenue is 7.01%.
That percentage is the most useful single number on this page, because it prices growth. Every additional dollar of revenue at the same operating shape drags roughly seven cents of cash into receivables and inventory before it comes back.
Grow revenue by $500,000 and you will need about $35,000 of additional working capital to support it, found before the growth rather than after.
This is why profitable companies run out of money. The profit and loss shows the margin on the new business. Nothing on it shows the cash the new business consumed on its way through. A company growing 40% a year on a 7% working capital intensity is funding a meaningful cash requirement out of a profit line that looks healthy.
Two levers reduce it, and they are the same two from the worked example. Shorten the cash conversion cycle, or finance the gap deliberately rather than discovering it. The 13-week cash flow forecast is where the second conversation starts.
What happens when you actually fix something
Here is the part most ratio writing skips.
Suppose collections improve by five days. DSO falls from 35.1 to 30.1 and receivables fall by five days of revenue, which is $27,945.
Now recompute the current ratio. Cash rises $27,945 and receivables fall $27,945. Total current assets are still $440,000. Current liabilities are unchanged. The current ratio does not move at all.
That is not a failure of the collections effort. It is a property of the ratio. Collecting faster swaps one current asset for another, and a ratio built on the total of current assets cannot see it. The quick ratio cannot see it either, because receivables are already inside it.
What does move is the cash conversion cycle, from 27.3 days to 22.3 days, and the actual cash in the account.
Now use the cash. Apply the $27,945 to current debt. Current assets fall to $412,055 and current liabilities fall to $269,055. The ratio becomes 1.53.
Covenant cleared. Not by collecting faster, which did nothing to the ratio, but by collecting faster and then retiring current obligations with the proceeds.
That is the operational reading. A ratio tells you where you are. It does not tell you which lever moves it, and the obvious lever often does not.
Read the three statements together or not at all
A single ratio is a fact without a cause. The cause is always in another statement.
Ratio falling, profit and loss improving. Growth is consuming working capital faster than margin is replacing it. Check the cash conversion cycle and the working capital percentage above. This is the most common pattern in a business that feels successful and short of money at the same time.
Ratio rising, profit and loss flat. Often inventory building or receivables ageing rather than anything good. A current ratio improved by slow-moving stock is a worse position wearing a better number.
Ratio stable, cash falling. Look at the non-current half of the balance sheet. Capital expenditure and debt repayment both consume cash without touching the current ratio at all.
Quick ratio deteriorating while the current ratio holds. Inventory is growing as a share of current assets. That is a purchasing or demand problem showing up in the balance sheet before it shows up anywhere else.
The balance sheet gives you a position, the profit and loss gives you a period result, and the cash statement explains the difference between them. Any one of the three read alone will mislead you, and the ratio is the most misleading of all because it looks like a conclusion.
Six ways ratio analysis misleads
One, computing from an unreclassified balance sheet. The current portion of long-term debt is the first thing a lender moves and the last thing a QuickBooks file does.
Two, trusting account types nobody reviewed. The split between current and non-current is entirely a function of how accounts were set up. Review it before you compute anything.
Three, ratios without a trend. A current ratio of 1.48 means nothing alone. Rising from 1.20 and falling from 1.90 are opposite situations with the same number.
Four, comparing across industries. A distributor and a consultancy have structurally different balance sheets. Compare against your own prior periods and your own covenants first.
Five, a stale A/R ageing. DSO computed on receivables that include uncollectible invoices flatters nothing and misleads everyone. Accounts receivable, invoicing and collections covers keeping the ledger real.
Six, reading liquidity without the cash statement. The balance sheet is a position. The cash flow statement is the movement, and the 13-week forecast is the direction. Three views, one question.
Build the trend before you build an opinion
One ratio is a number. Three periods is a direction. Twelve is a diagnosis.
Export the balance sheet for the last twelve month-ends into one sheet, apply the reclassification to each of them, and compute all five measures per period. It is an afternoon once and five minutes a month after that.
What you are looking for is not the level. It is the slope, and the point where the slope changed. A current ratio that fell from 1.90 to 1.48 over four quarters is a trajectory with a cause you can still find. The same 1.48 arrived at from 1.20 is a recovery.
Put the covenant on the same chart as a horizontal line. The useful question is never whether you are above it today. It is how many quarters of the current slope remain before you are not, which is a number you can act on and a number you can take to a lender before they raise it with you.
Thresholds: how often and how deep
No debt, no covenants, no outside capital. Cash conversion cycle monthly. The ratios are background.
Any lender covenant. Compute the covenant ratio the way the agreement defines it, monthly, with the reclassification applied. The agreement's definition beats the textbook one every time.
Inventory-heavy. The quick ratio is the one that matters, because the current ratio is flattered by stock you may not be able to move. FIFO versus average cost determines what that stock is even carried at.
Seasonal. Compute at the same point in the cycle every year. A quarter-end ratio in your peak month is not comparable to one in your trough.
Raising or refinancing. Expect every number recomputed by someone else. Reclassify first and show your work.
Rapid growth. Watch the cash conversion cycle rather than the ratios. Growth consumes working capital, and the cycle shows it first.
How Finlens approaches this
A ratio is only as honest as the classification underneath it.
Finlens reclassifies the current portion of long-term debt every month from the amortization schedule rather than once a year under audit pressure, so the current ratio in management reporting is the same one a lender would compute. Account types are reviewed against the current and non-current split rather than assumed.
The four measures are tracked as a trend, not a snapshot, and reported alongside the cash statement so a position and a movement are never read in isolation.
Where a covenant exists, it is computed the way the agreement defines it, which is frequently not the textbook formula. Budgets, forecasts and variance analysis covers the forward half of the same picture.
Verification checklist
FAQ
Does QuickBooks calculate the current ratio?
No. QuickBooks produces no financial ratio reports at all. Export the balance sheet and compute them in a spreadsheet.
Does QuickBooks split out the current portion of long-term debt?
No, and most Desktop versions do not either. It has to be moved manually by journal entry from the amortization schedule and updated as payments are made.
What is a good current ratio?
The one in your loan agreement, if you have one. Absent that, the direction matters more than the level. Compare against your own prior periods before any industry benchmark.
Why is my quick ratio so much worse than my current ratio?
Because inventory and prepaid expenses are excluded. A large gap between the two means your liquidity depends on selling stock, which is a fact worth knowing before a lender points it out.
Will collecting receivables faster improve my current ratio?
No. It swaps receivables for cash inside current assets and the total does not change. It improves the cash conversion cycle and your actual cash. To move the ratio, use that cash to reduce current liabilities.
Should DPO use total expenses or cost of sales?
Cost of sales, matched to the payables being measured. Using total expenses inflates the denominator and understates how long you are actually taking to pay.
How often should I compute these?
Monthly if you have a covenant or outside capital. Quarterly otherwise. The cash conversion cycle is worth watching monthly in any growing business.
Where do credit cards belong?
Current liabilities. They have their own account type in QuickBooks and excluding them understates the denominator of both liquidity ratios.
How much working capital does growth require?
Take working capital as a percentage of revenue, then apply it to the revenue increase you are planning. At 7% intensity, half a million of new revenue needs roughly thirty-five thousand of additional funding before the first invoice is collected.

